The incident analyses from the analysis area can also be used as a widget on the dashboard. This gives you a full overview of all problems at any time and shows you where the greatest need for action is.
You can place the widgets for the incident analyses on the dashboard in exactly the same way as all other widgets. To do this, either select the grid area to be used or click on the "+" in the dashboard configuration. In the following dialogue, select Incidents and Incident Analyses. You now have a choice of 4 analyses:
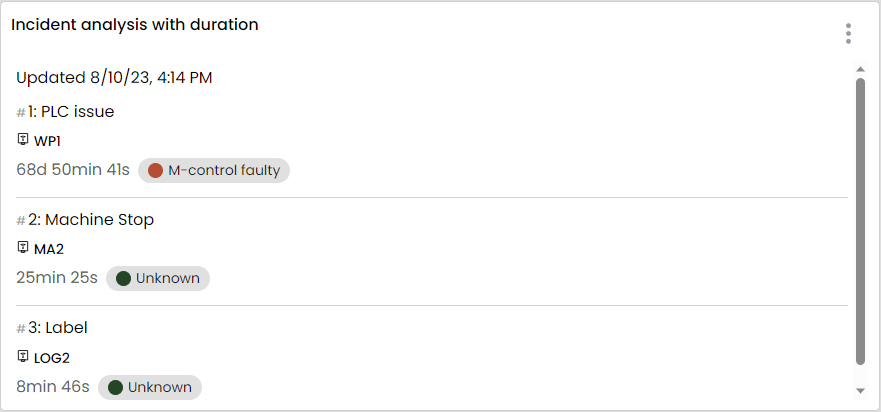
- Incident analysis by duration: Here you can see all incidents in your company. These are sorted by duration in descending order.
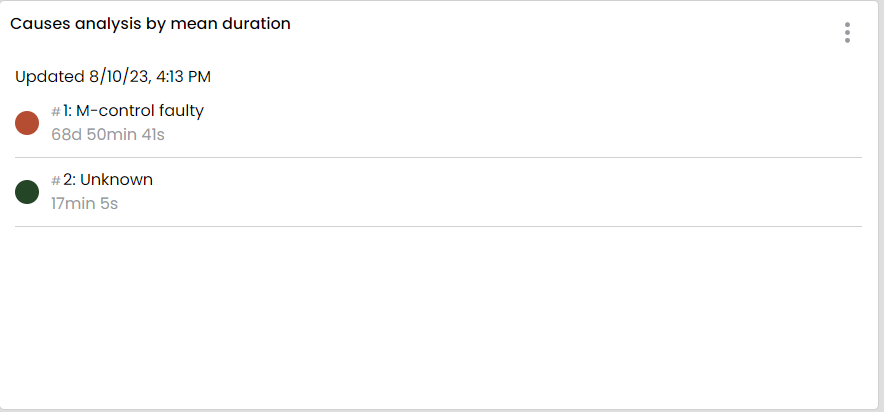
- Cause analysis by average duration: Here you can see the causes of the incidents. Sorted according to the average duration of the incidents for which the cause was assigned.
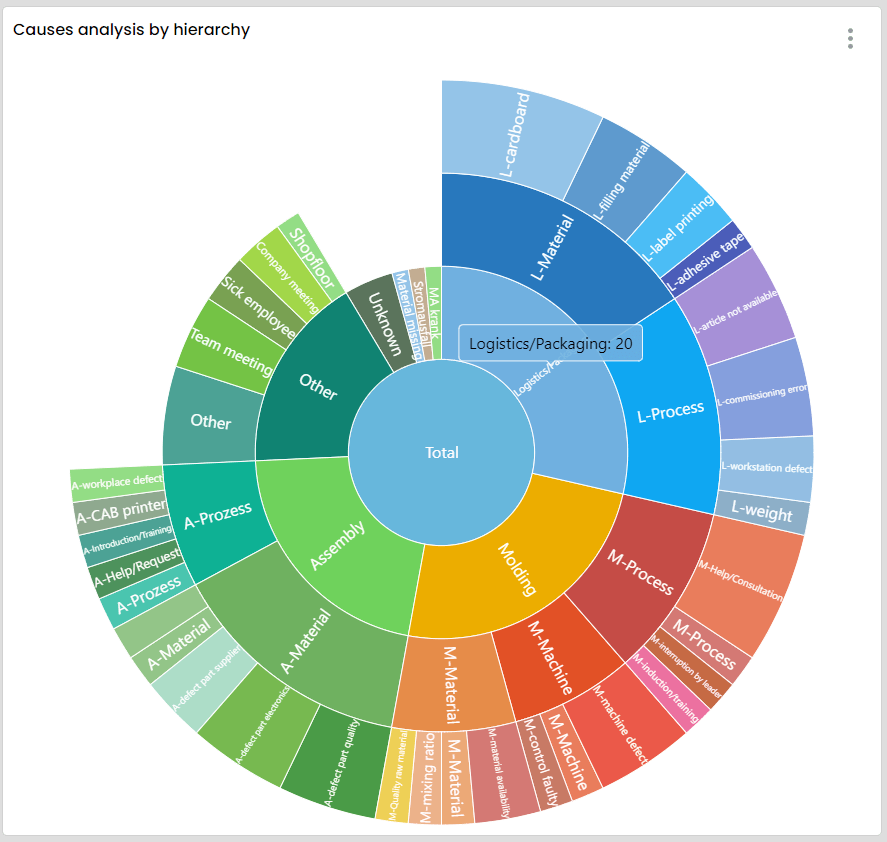
- Cause analysis by hierarchy: Here you can see all causes in the hierarchy you have defined. The analysis is visualised in a Sunbust diagram in which you can drill down to see the individual hierarchy levels in more detail. You can immediately see which causes were responsible for the most frequent problems. By clicking on a subordinate level, the causes of the level are fanned out again.
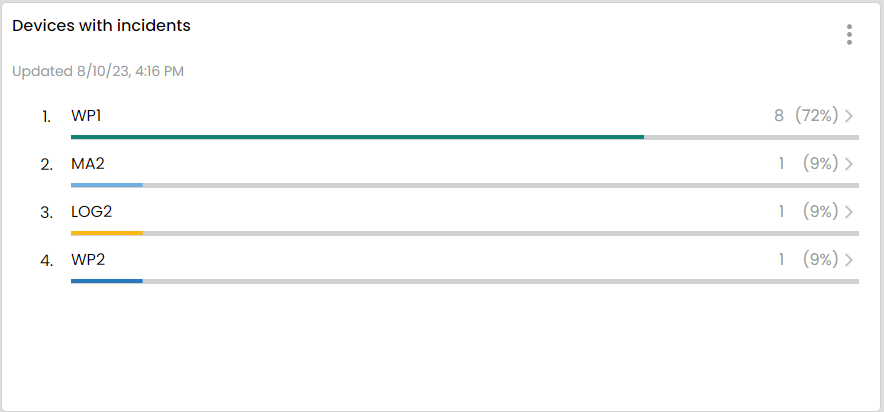
- Devices with incidents: In this analysis, only the devices that you include in the configuration of the widget are taken into account. These are then sorted by the number of incidents and you can see which device has the most incidents. If you now want to see the causes of the incidents, you can click on the desired device and a sunburst diagram opens with the causes of the incidents of this device.
If you have selected the desired analysis, you will now see the configuration dialogue of the widget in which you can make the following settings:
- Title: Here you can name the widget according to your wishes.
- Period: Here you can select the period you want to view.
- Refresh data: If you have not selected a fixed period (e.g. last week) but a variable period (e.g. last hour) that is to be updated cyclically, you can set here the cycle in which the data is to be updated.
For the analysis "Devices with incidents" there are two further setting options:
- Devices: Here you select the devices you want to view.
- Visualisation: You have the choice between a simple table or a donut diagram. In both variants you can open the sunburst diagram by clicking on the device.

Once you have made all the settings, you can place the widget.