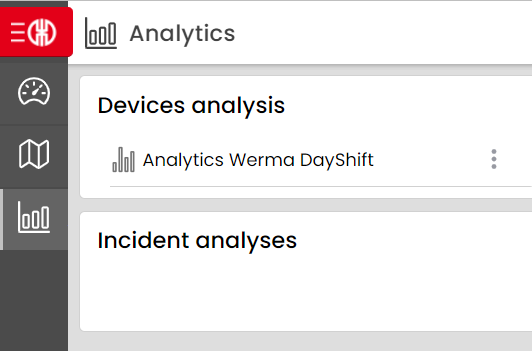
Similar to the analysis widgets, the analysis area of WeASSIST is also based on categories and attributes. The analysis area differs from the widgets on the dashboard in the respect that different configured analyses can be saved individually and also incidents and root causes can be analyzed (will be covered in another article). The device analyses provide further display and comparison options in this area.
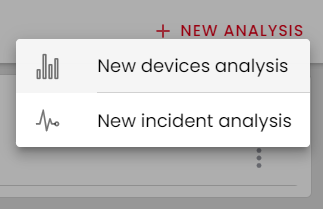
Add a new device analysis to configure your own "Report". To configure it, make the following settings:
- Period
- Key figure
- Chart type
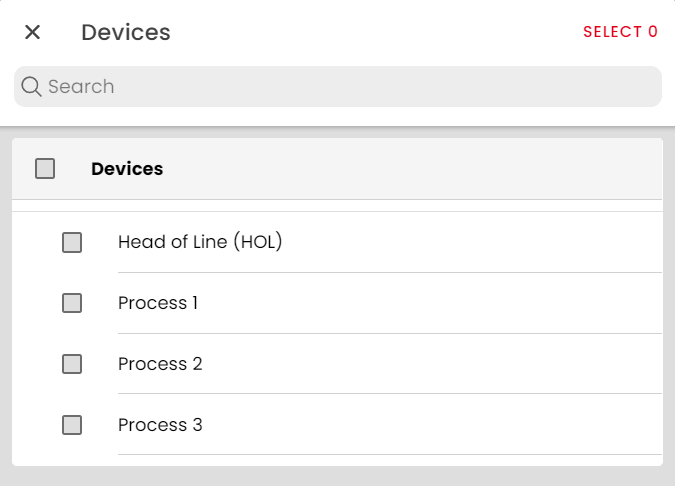
- Devices
- Category
- Working hours
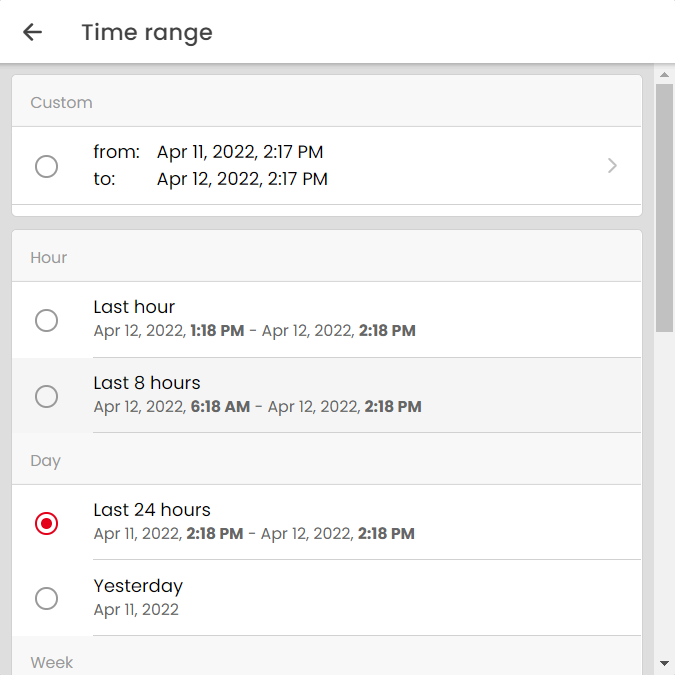
When defining the time period, you can choose a predefined time period as usual or define an individual range.
After you have determined which time period you would like to analyze, choose between the options to visualize the duration or the frequency of various attributes of a category. However, you are also free to display both key figures.
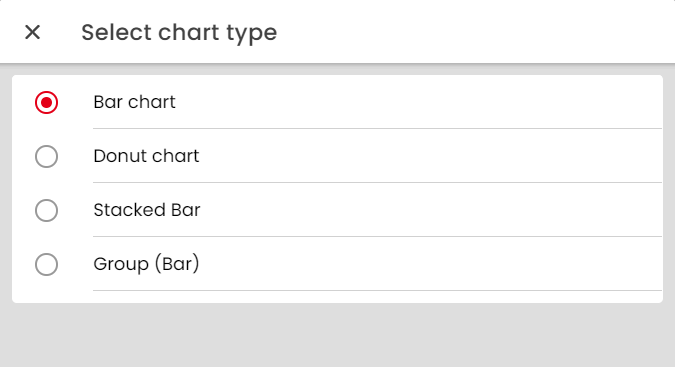
In contrast to the analysis widgets on the dashboard, you now have four different chart types to choose from. Already known are the bar chart and the pie chart. In addition, a stacked and a grouped bar chart are available here. More detailed information about the different chart types can be found in the article "Charts and their meaning".
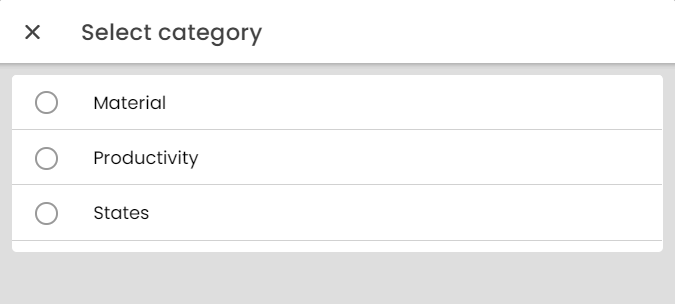
Once you have determined which devices are to be analyzed, you are now faced with selecting the category to be analyzed and the working times (working times are described in more detail in the article "Specifying working times for analyses"). A chart is created for each device and key figure.
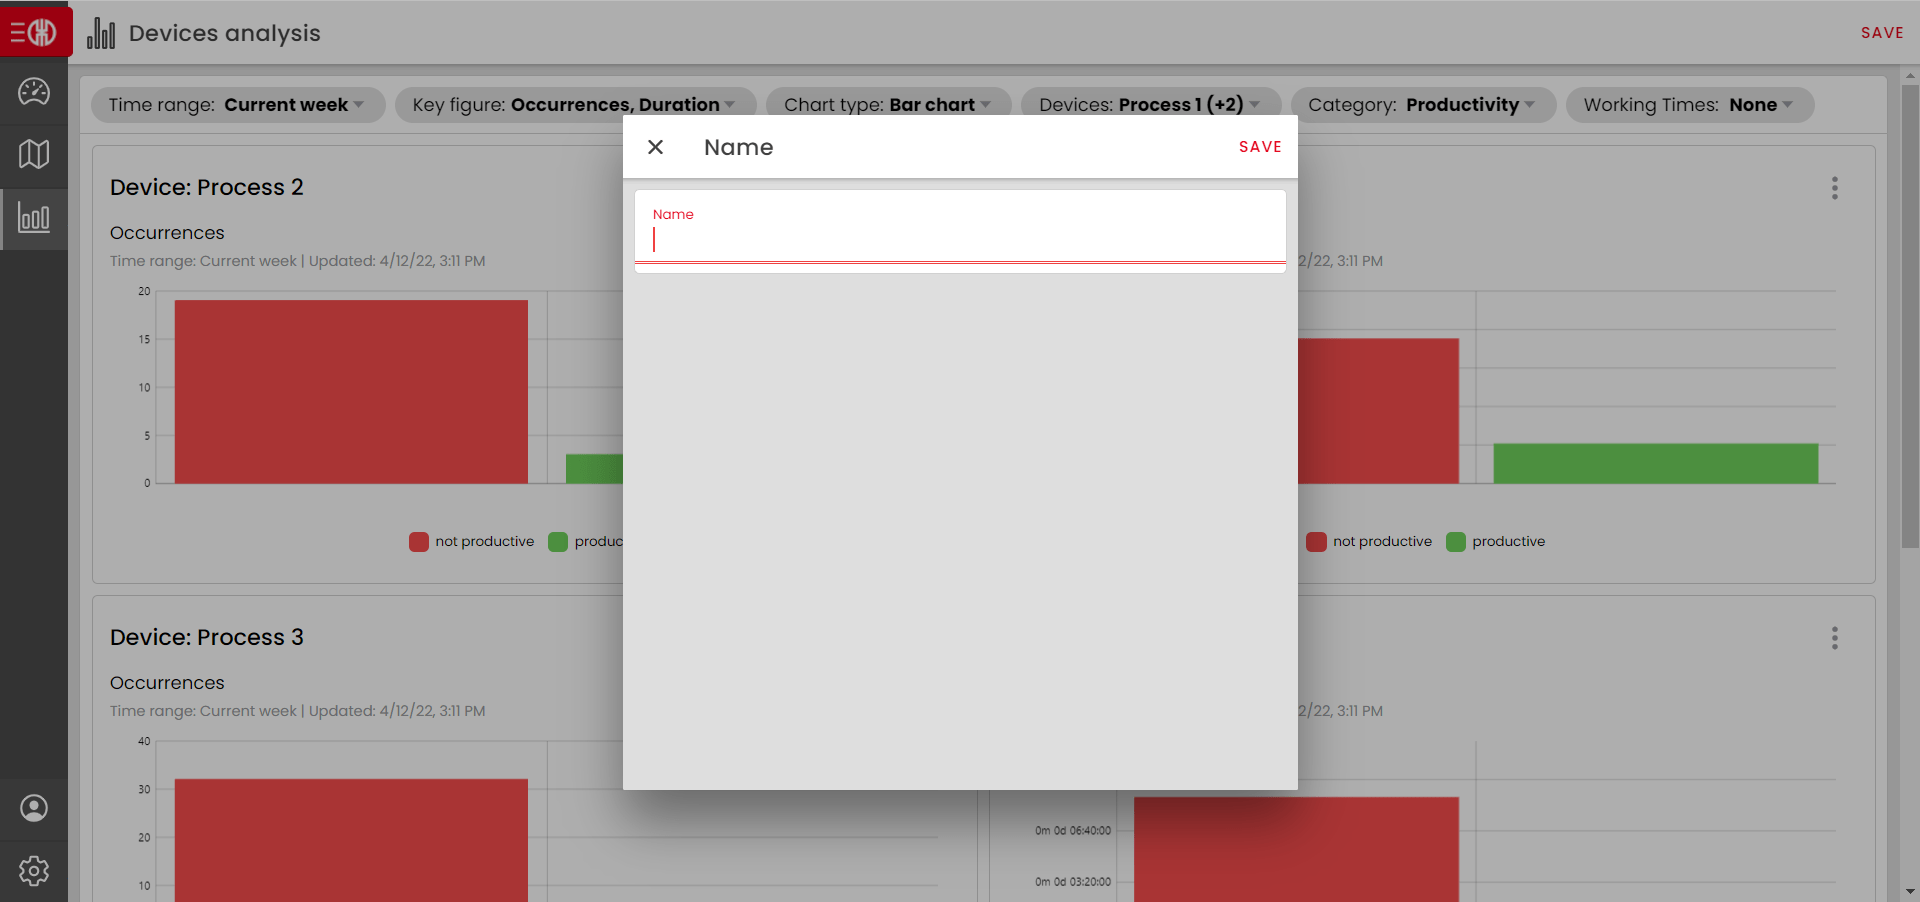
Now you have created your own device analysis and can save it by clicking the "Save" button in the upper right corner and assign a name. If you do not save the report, it will be lost and you will have to compile it again.
Once you have saved the report, you will find it in the device analysis selection under the name you assigned.

If you want to delete or rename the analysis you have created, you can do this via the menu that appears when you click on the three dots at the top right. Furthermore, you can use the "Export" button to compile a CSV export of the data you want (see article CSV export).
Tip:
- To compare different devices with each other, the stacked and grouped bar charts are useful (see article Charts and their meaning).
- In the case of saved analyses, a CSV export with the parameters defined in this analysis can be downloaded via the download icon.