In the article "Analyzing devices by categories and attributes" you have already learned how to create and save your own analysis. You have several diagram types to choose from to design your analysis.
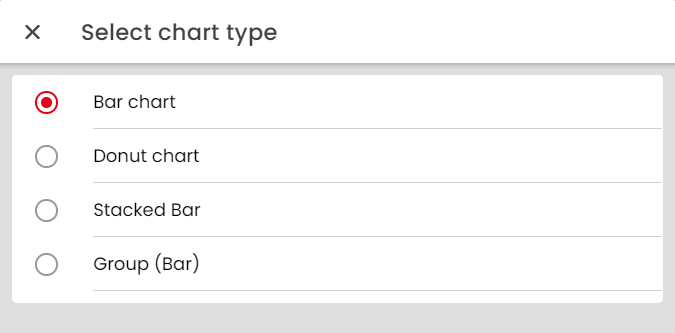
- Bar chart
- Pie chart
- Stacked bar chart
- Grouped bar chart
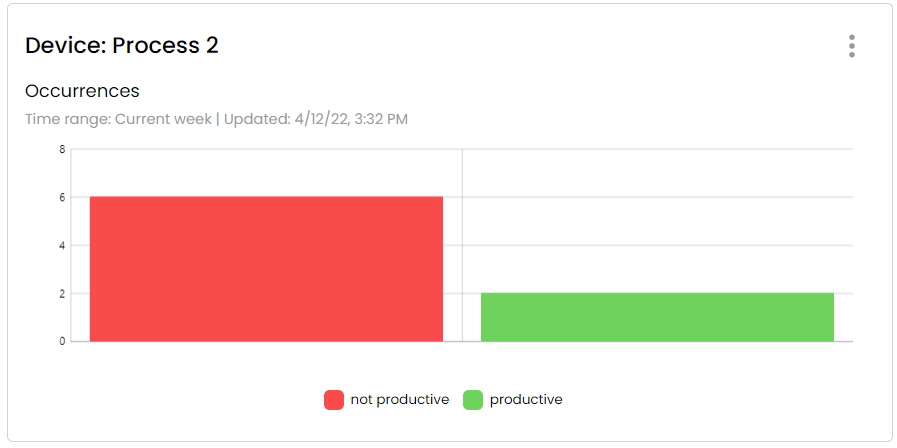
The bar chart, or signal tower chart, is particularly useful for displaying frequencies. When you select a category for your analysis, the bars show the frequency or duration from concern of various attributes. The frequency is shown here as a whole number and the duration in the format "months days hours:minutes:seconds".
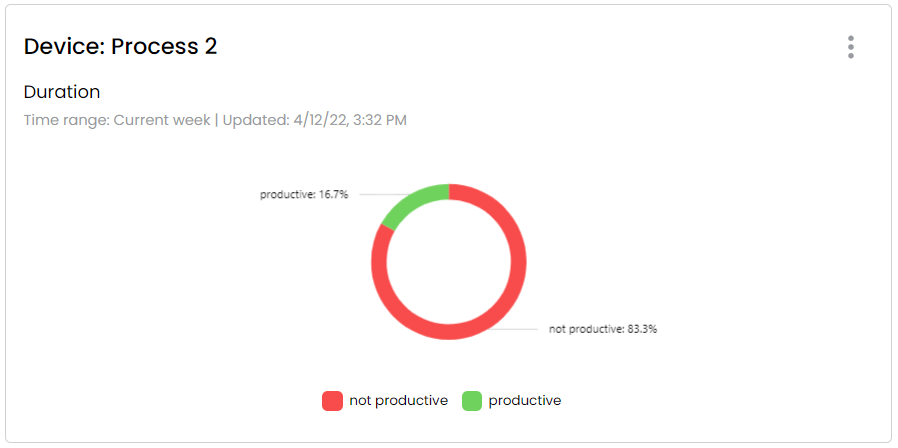
The pie chart, on the other hand, is particularly suitable for displaying the duration of various attributes. The respective attributes are colored in the circle and provided with a calculated percentage value, so that it is clear at a glance which characteristic was present and for how long.
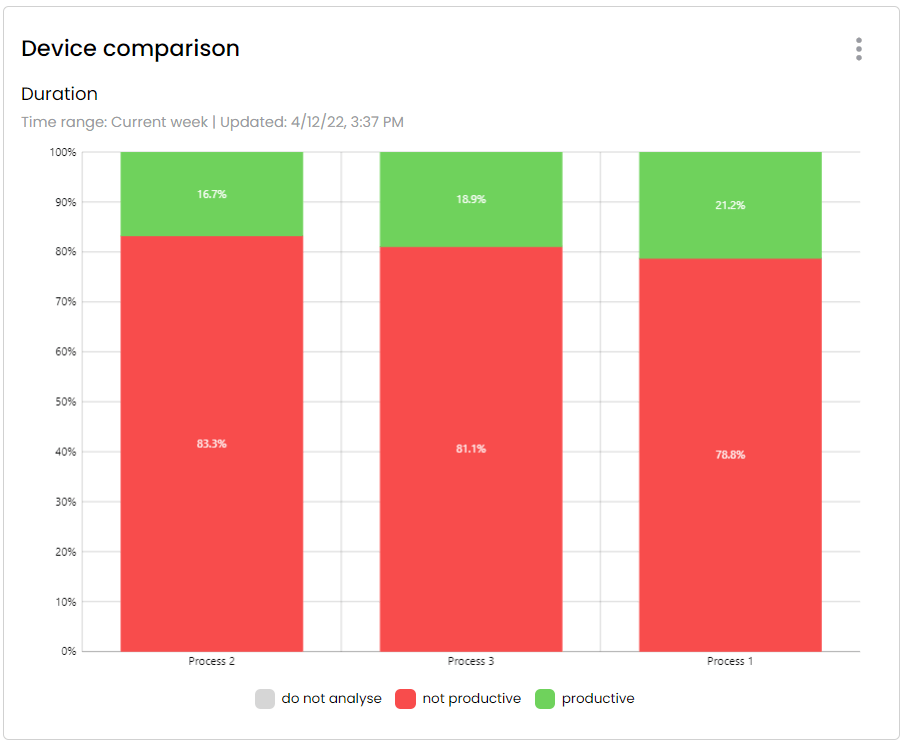
The stacked bar chart is particularly suitable for comparing different attributes for a device. This diagram visualizes the percentage values of the attributes independently of the key figure. One bar with 100% is created for each device and key figure. The percentage values associated with the attributes are arranged one above the other. The order of arrangement remains fixed for each diagram, so that several devices can be placed next to each other and compared.
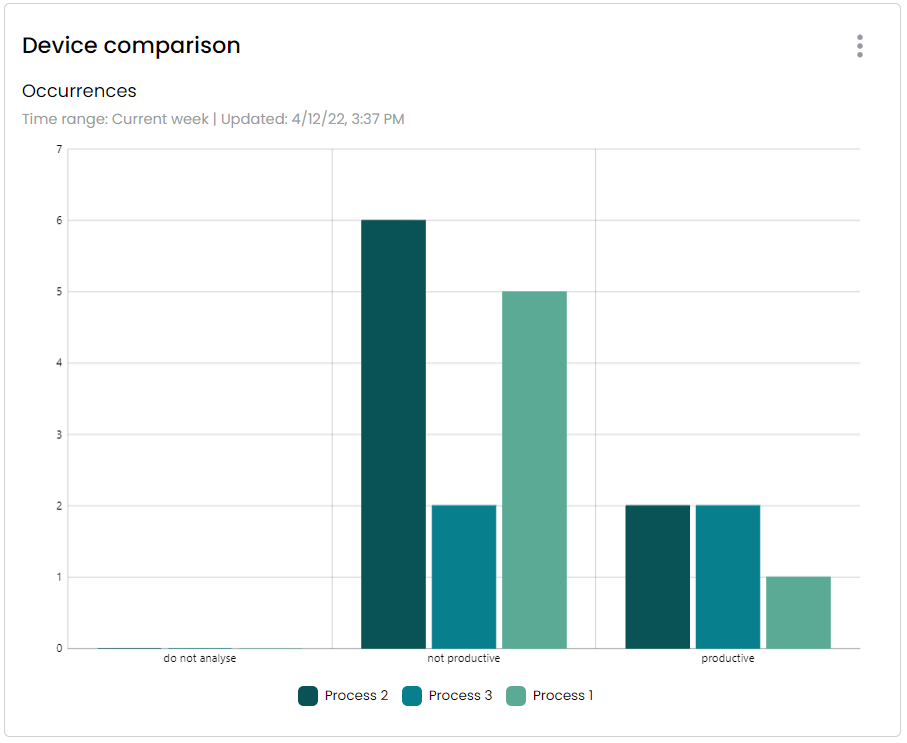
The grouped bar chart differs from the stacked bar chart in that the grouped chart displays one bar per device for each characteristic. In this diagram, as in the bar chart, the values for frequency and duration are displayed in absolute numbers. Here, frequencies of different attributes in particular can be compared relatively quickly.
Tip: If you do not want to view a characteristic in your analysis, you can simply hide it by clicking on it in the legend area of the diagram. You can also do this by clicking on the attributes in the diagram.